Using the monitoring tool
Use our monitoring tool to quickly check what the status is of the use of your application's resources.
After reading this article, you'll know how to:
-
Find the monitoring tool
-
Read the overview
The application monitoring tool is found within your application's options. Simply go to your organization, then to an application. You can then find the option when you click on the triple dots, a dropdown opens in which the monitor options is located.
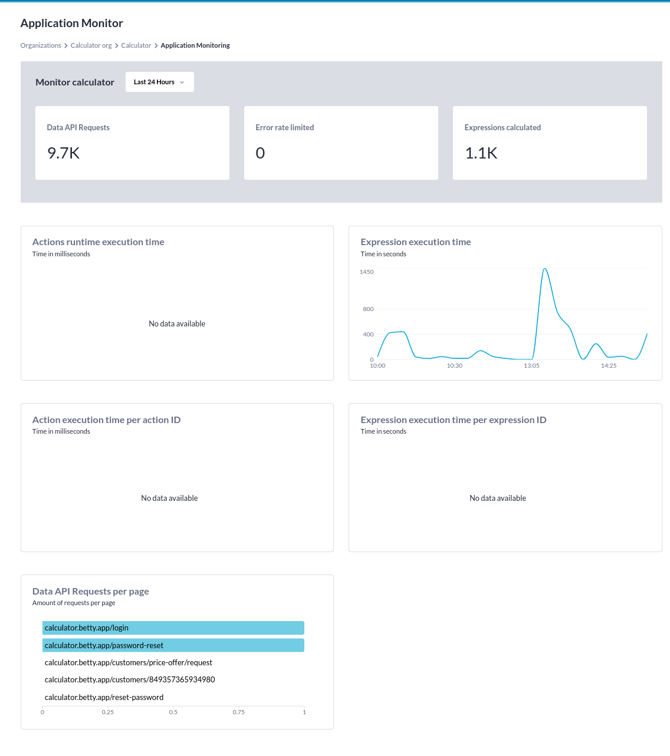
The monitoring overview shows you a bunch of stuff, from your application's data API requests to the action runtime and execution time. You can filter on the last 24 hours as you can see in the image below.
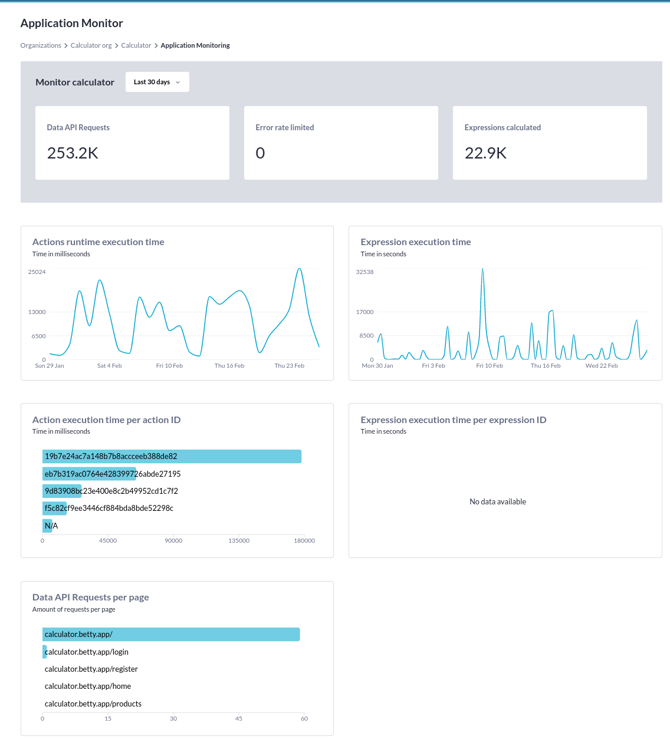
But also on the last 30 days to see how your application has been doing. This is useful to see when and most likely why spikes occurred. You could, for example, spot a pattern that each week on Sunday spikes are happening, this information can then help you pinpoint why that's the case.
The different tables and what they do
|
Actions runtime execution time |
This graph shows you how much time (in milliseconds) it took to execute actions in the runtime of your application. |
|
Expression execution time |
The time it took (in seconds) to calculate the expressions that are used in your application. |
|
Action execution time per action ID |
The time (in milliseconds) it took for an action to run. |
|
Expression execution time per expressions ID |
The time (in seconds) it took for an expression to run. |
|
Data API requests per page |
The amount of data API requests by page. |


